Setting up the Go Debugger in GoLand
Being able to use the debugger in GoLand makes debugging Go code easy. Let’s go through everything you need to do to get started!
To get setup with GoLand, simply download and install GoLand from here.
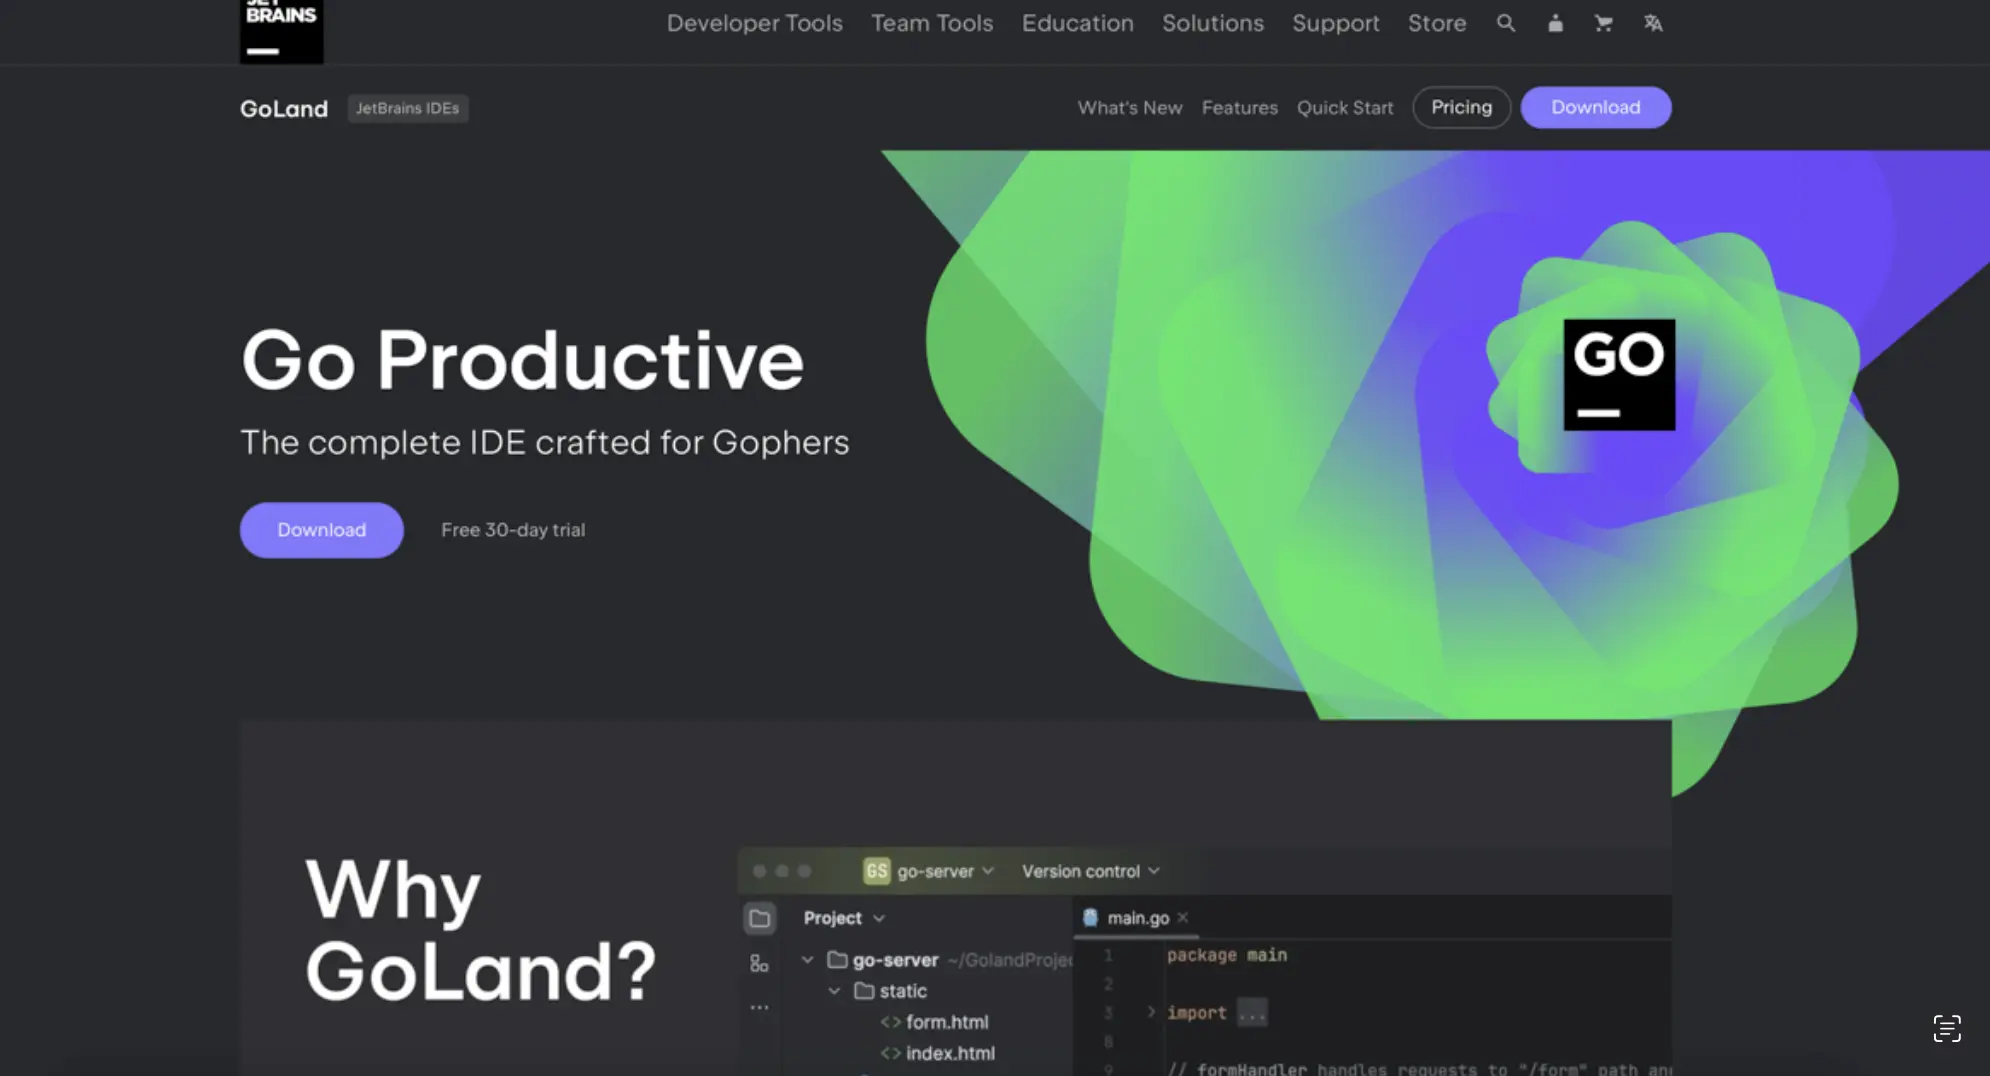
At the time of writing, the page looks something like this. As you can see you sign up for a 30 day free trial if you want to just try it out.

Once installed, there is no specific configuration necessary to get the debugger running, unlike in VSCode
What is a breakpoint and how do I set one in GoLand?
Breakpoints can be thought of as a pause in your program.
If there is a specific line, value or point in our program where slowing things down to allow further analysis would be helpful, we can set a breakpoint to be able to do it.
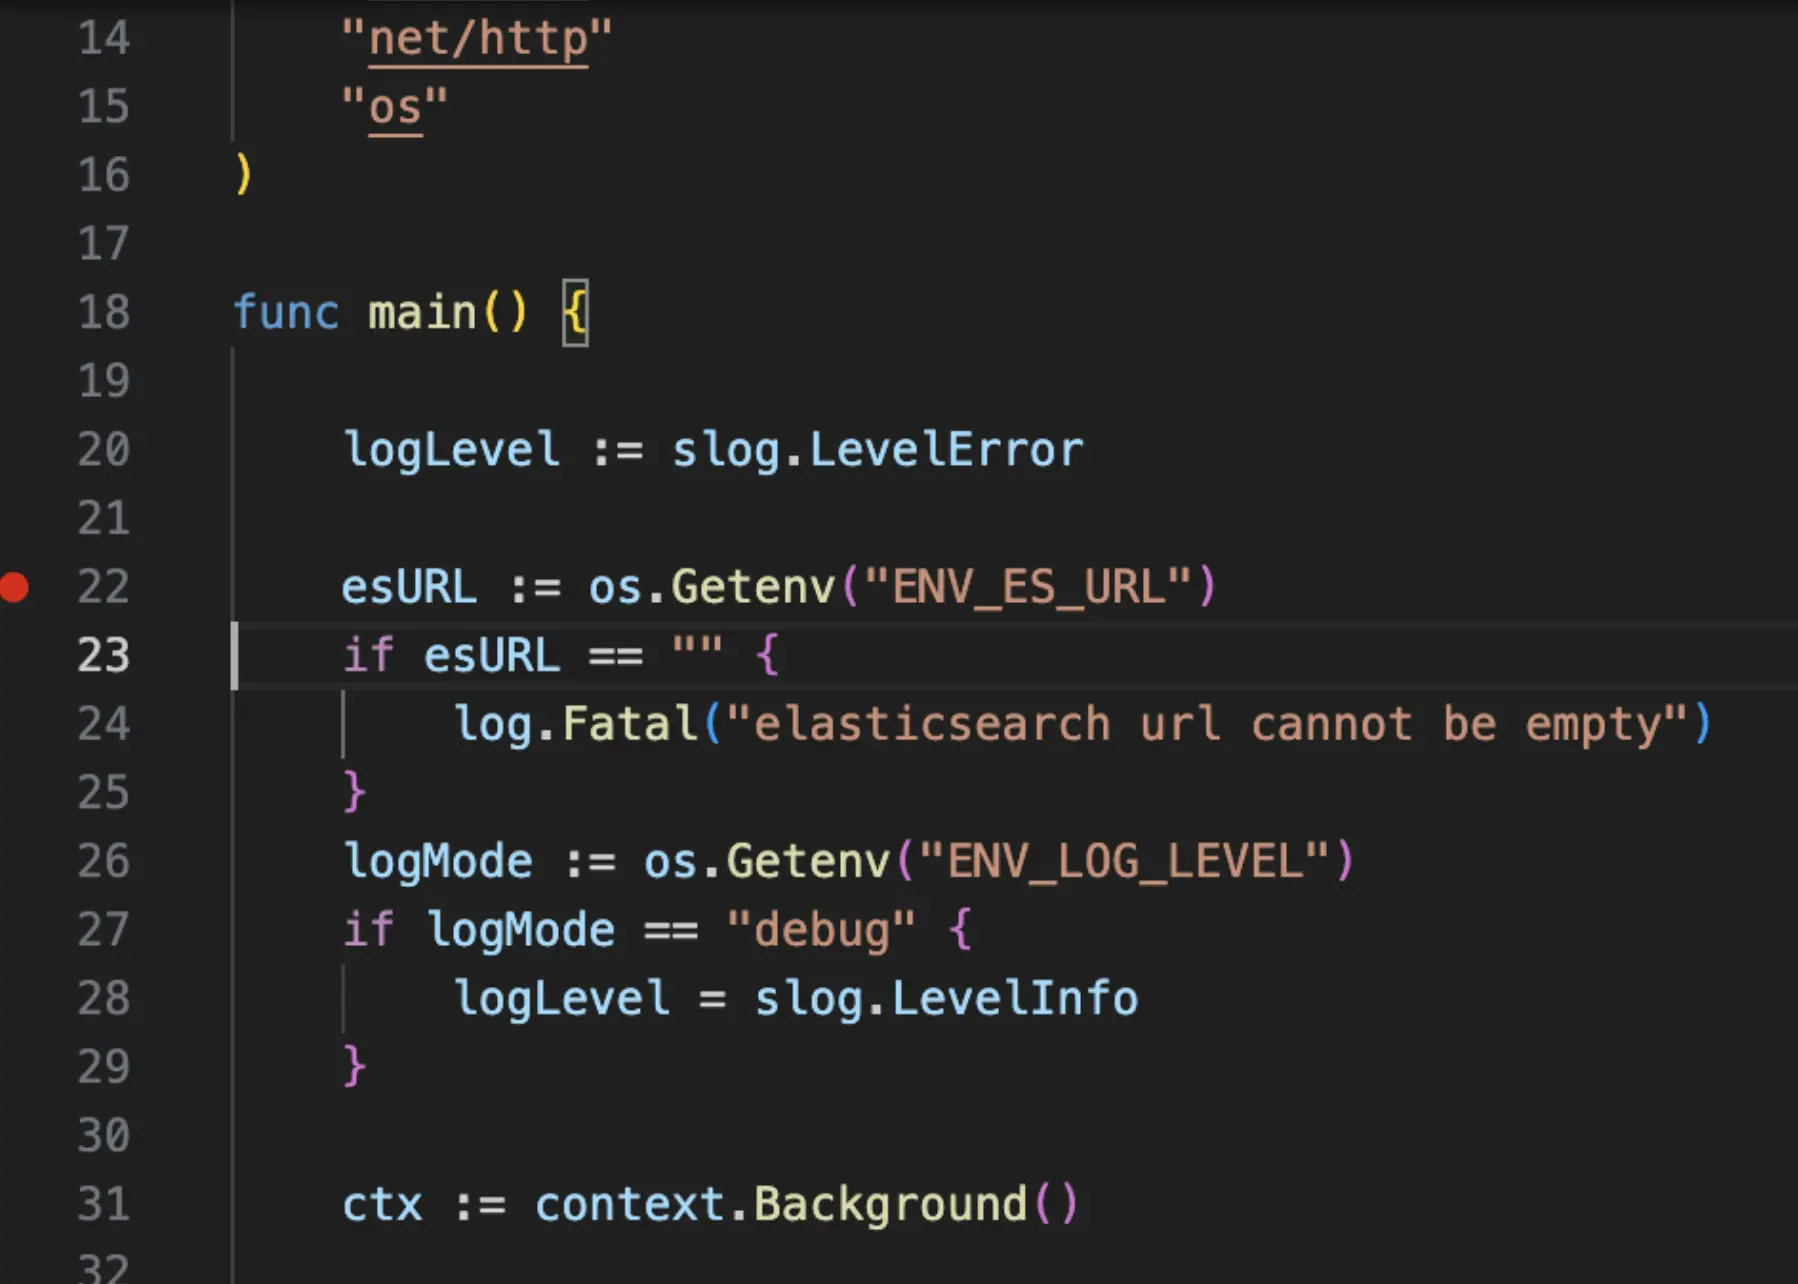
To set a breakpoint in GoLand, we simply need to left-click in the gutter (the left hand side where the line numbers are) and it will put a small dot there to acknowledge the fact that we would like the program to pause there. It will look something like this.

You can left-click the breakpoint again to remove it. You can also right-click it to suspend it or add conditional logic:

Debugging using the debugger in GoLand
Once we have a breakpoint set, it is time to run the debugger, which will enable us to debug our Go program in GoLand. In GoLand, you don’t need to do any extra setup here (unlike in VSCode). Simply hit the bug icon in the top right.
Once pressed, your program should hit the breakpoint and show highlighted panels.
That’s it!
You now know everything you need to know to begin debugging using the debugger in GoLand. If you’d like to learn more about debugging, including advanced techniques on using the debugger, you should check out this book which will teach you all you need to know.
