
Setting up the Go Debugger in VSCode
Firstly, navigate to here and download the installer for your machine. Once downloaded, open the installer and follow the prompts to install VS Code.
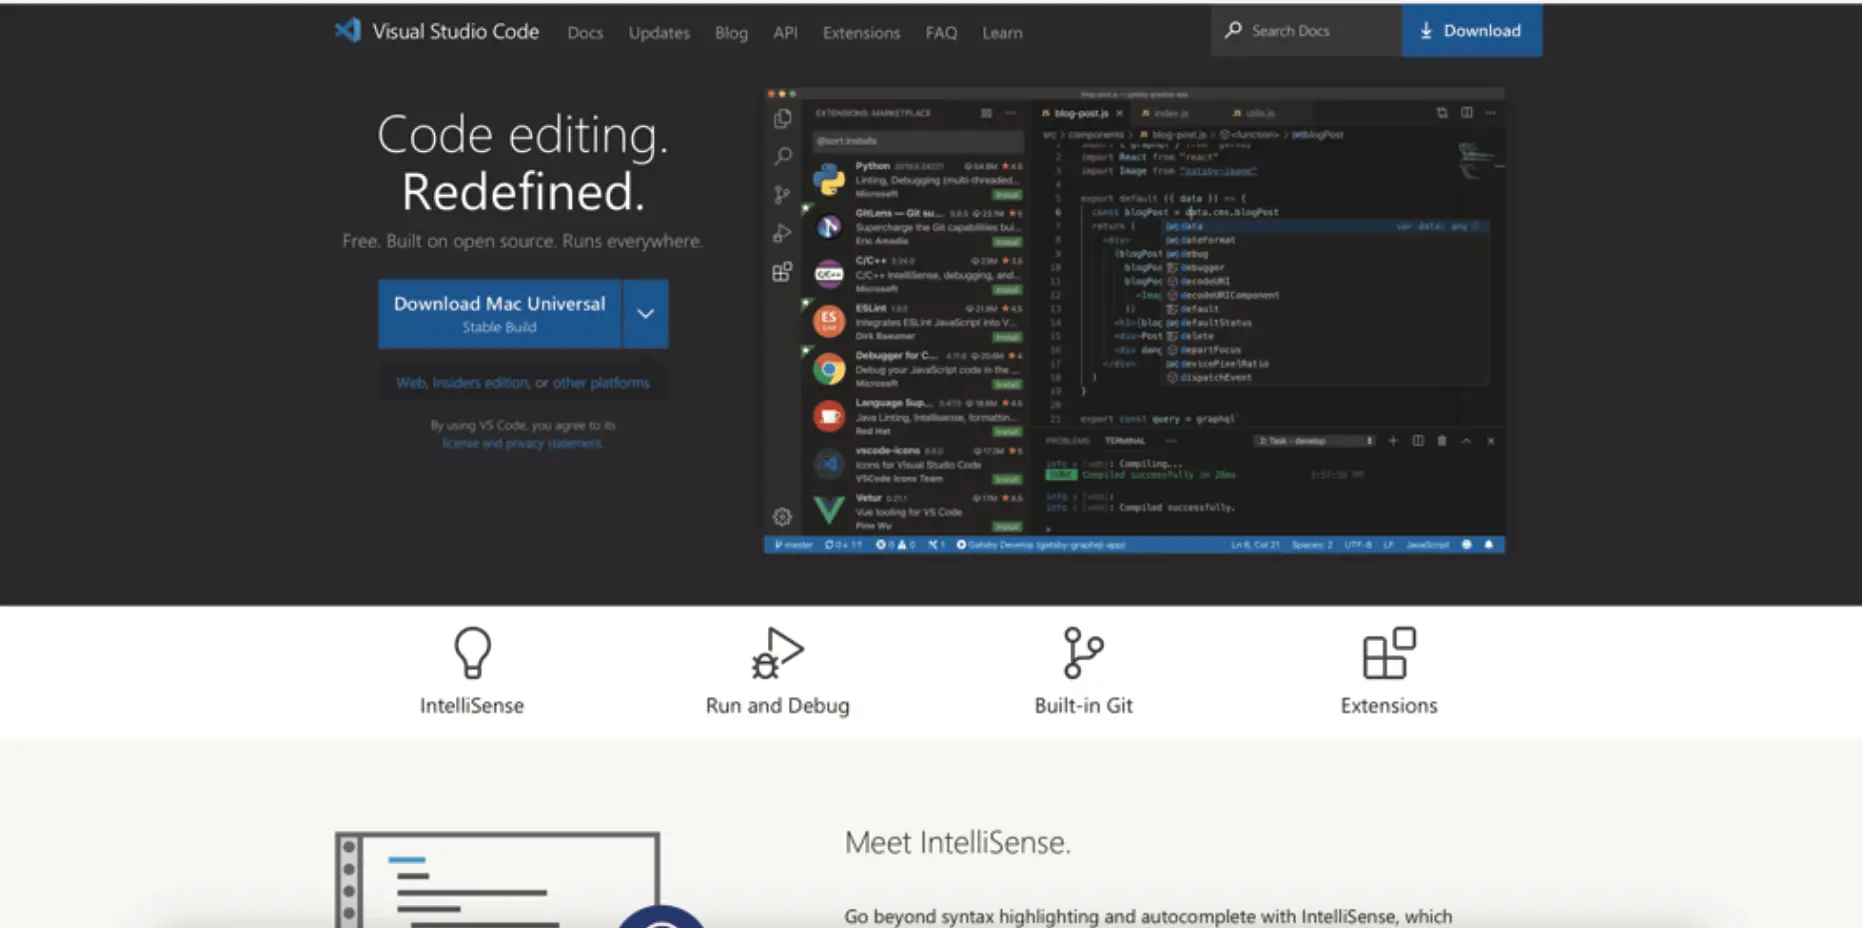
Next, open a Go project. Any will do. Creating a new one is fine also. You can open an existing project by selecting ” Open Folder” from the welcome screen or by going to File > Open Folder.
To enable debugging features for Go, you’ll need to install the Go extension from the VS Code Marketplace using this link.
Once you have done this, you might notice a banner in the bottom right corner of VSCode, with a message saying some other Go dependencies are missing or there are missing pieces or tools. If you click on it, it’ll tell you that you need to install Go PLS and some other things to make the debugger work. Just click on it and hit install.
You should be good to go with VSCode!
Now it’s installed, how do we use it?
Setting Breakpoints in VSCode
In VScode, If you want to remove or disable a breakpoint, you can simply right click on it and you’ll see the following options:
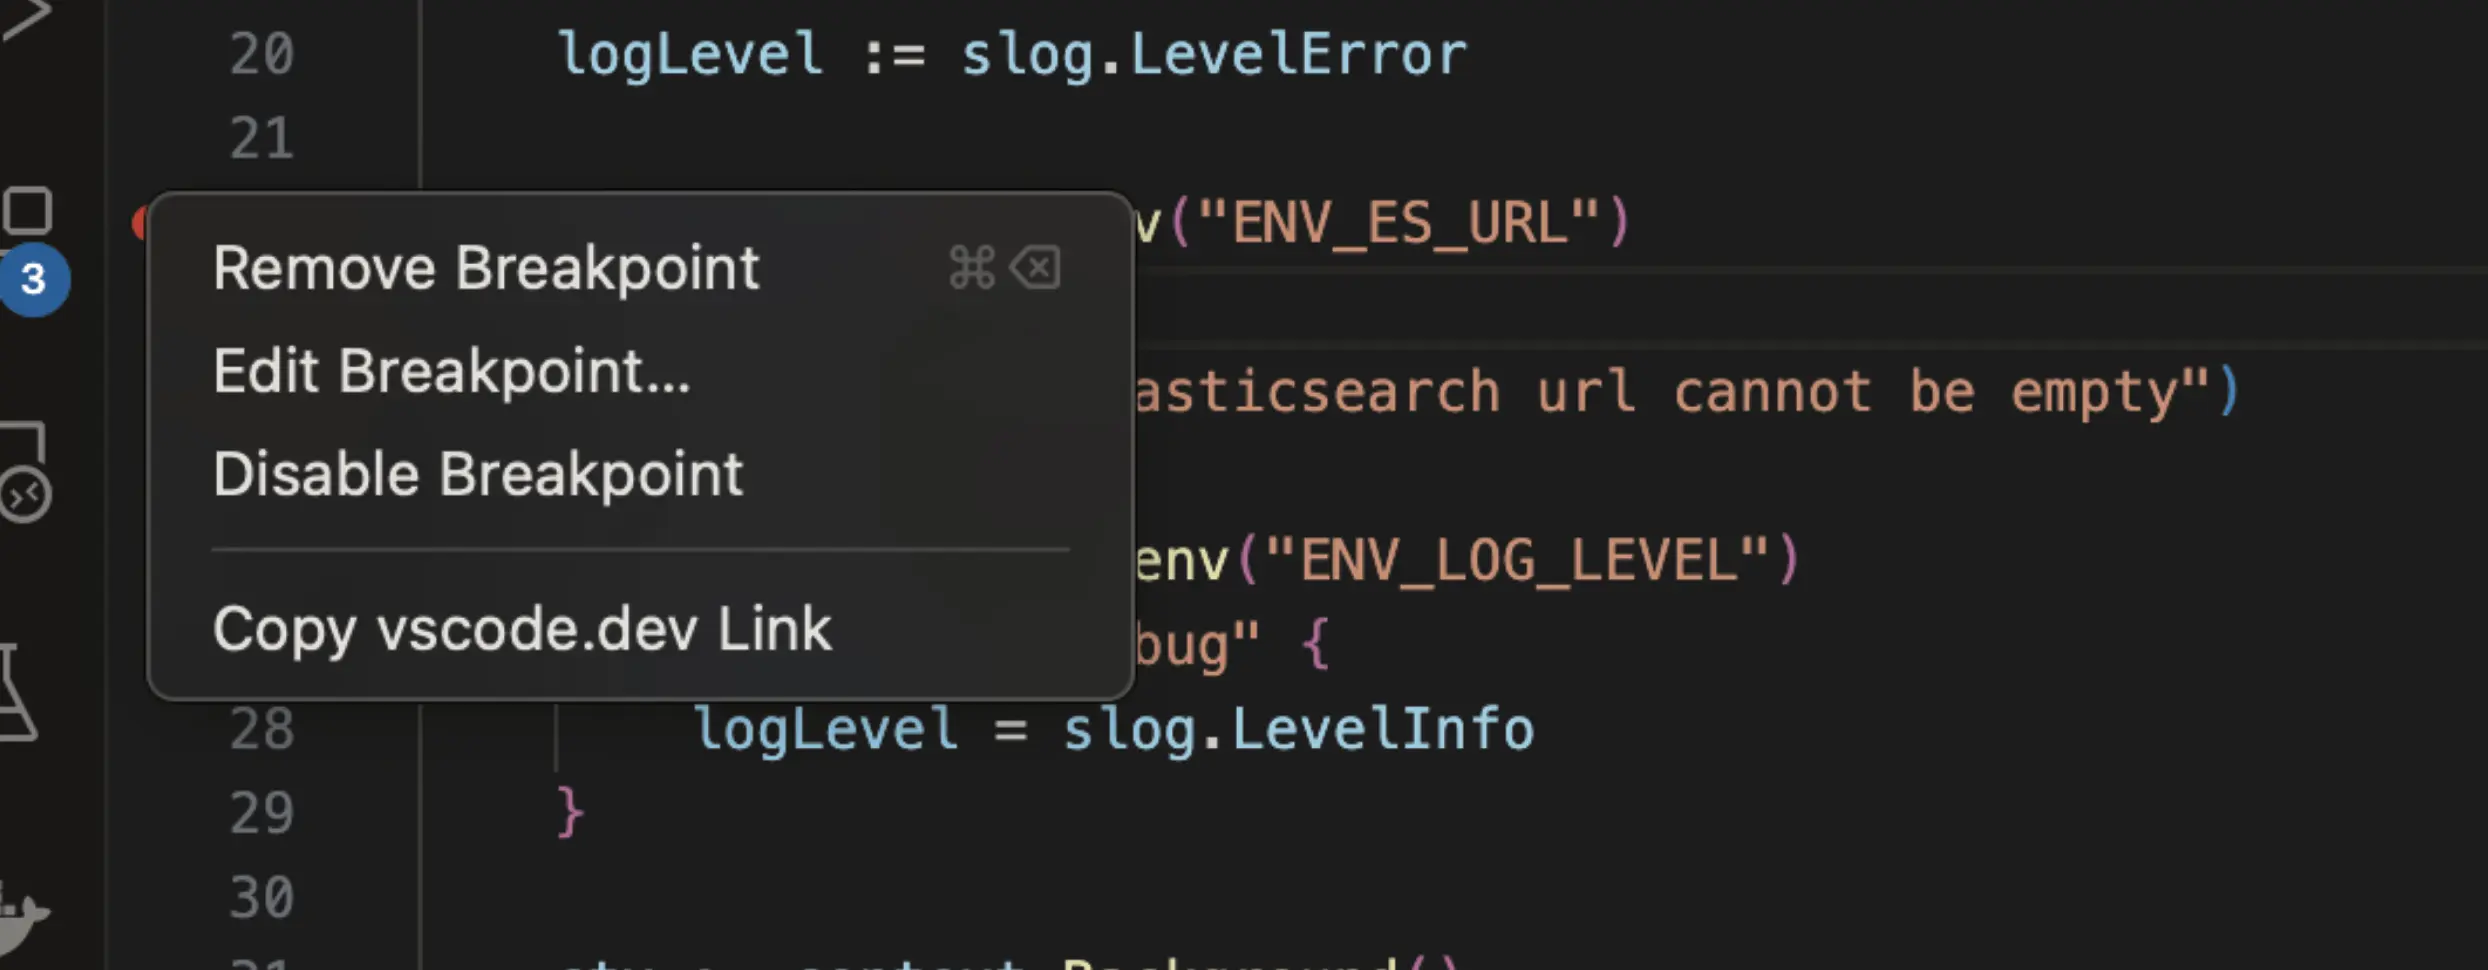
Once we have a breakpoint set, it is time to run the debugger.
Running the Debugger
In VSCode, you can click the “Run And Debug” button on the left hand side (bottom icon in the screenshot provided). The first time you do it you will see that you need to create a launch.json file.
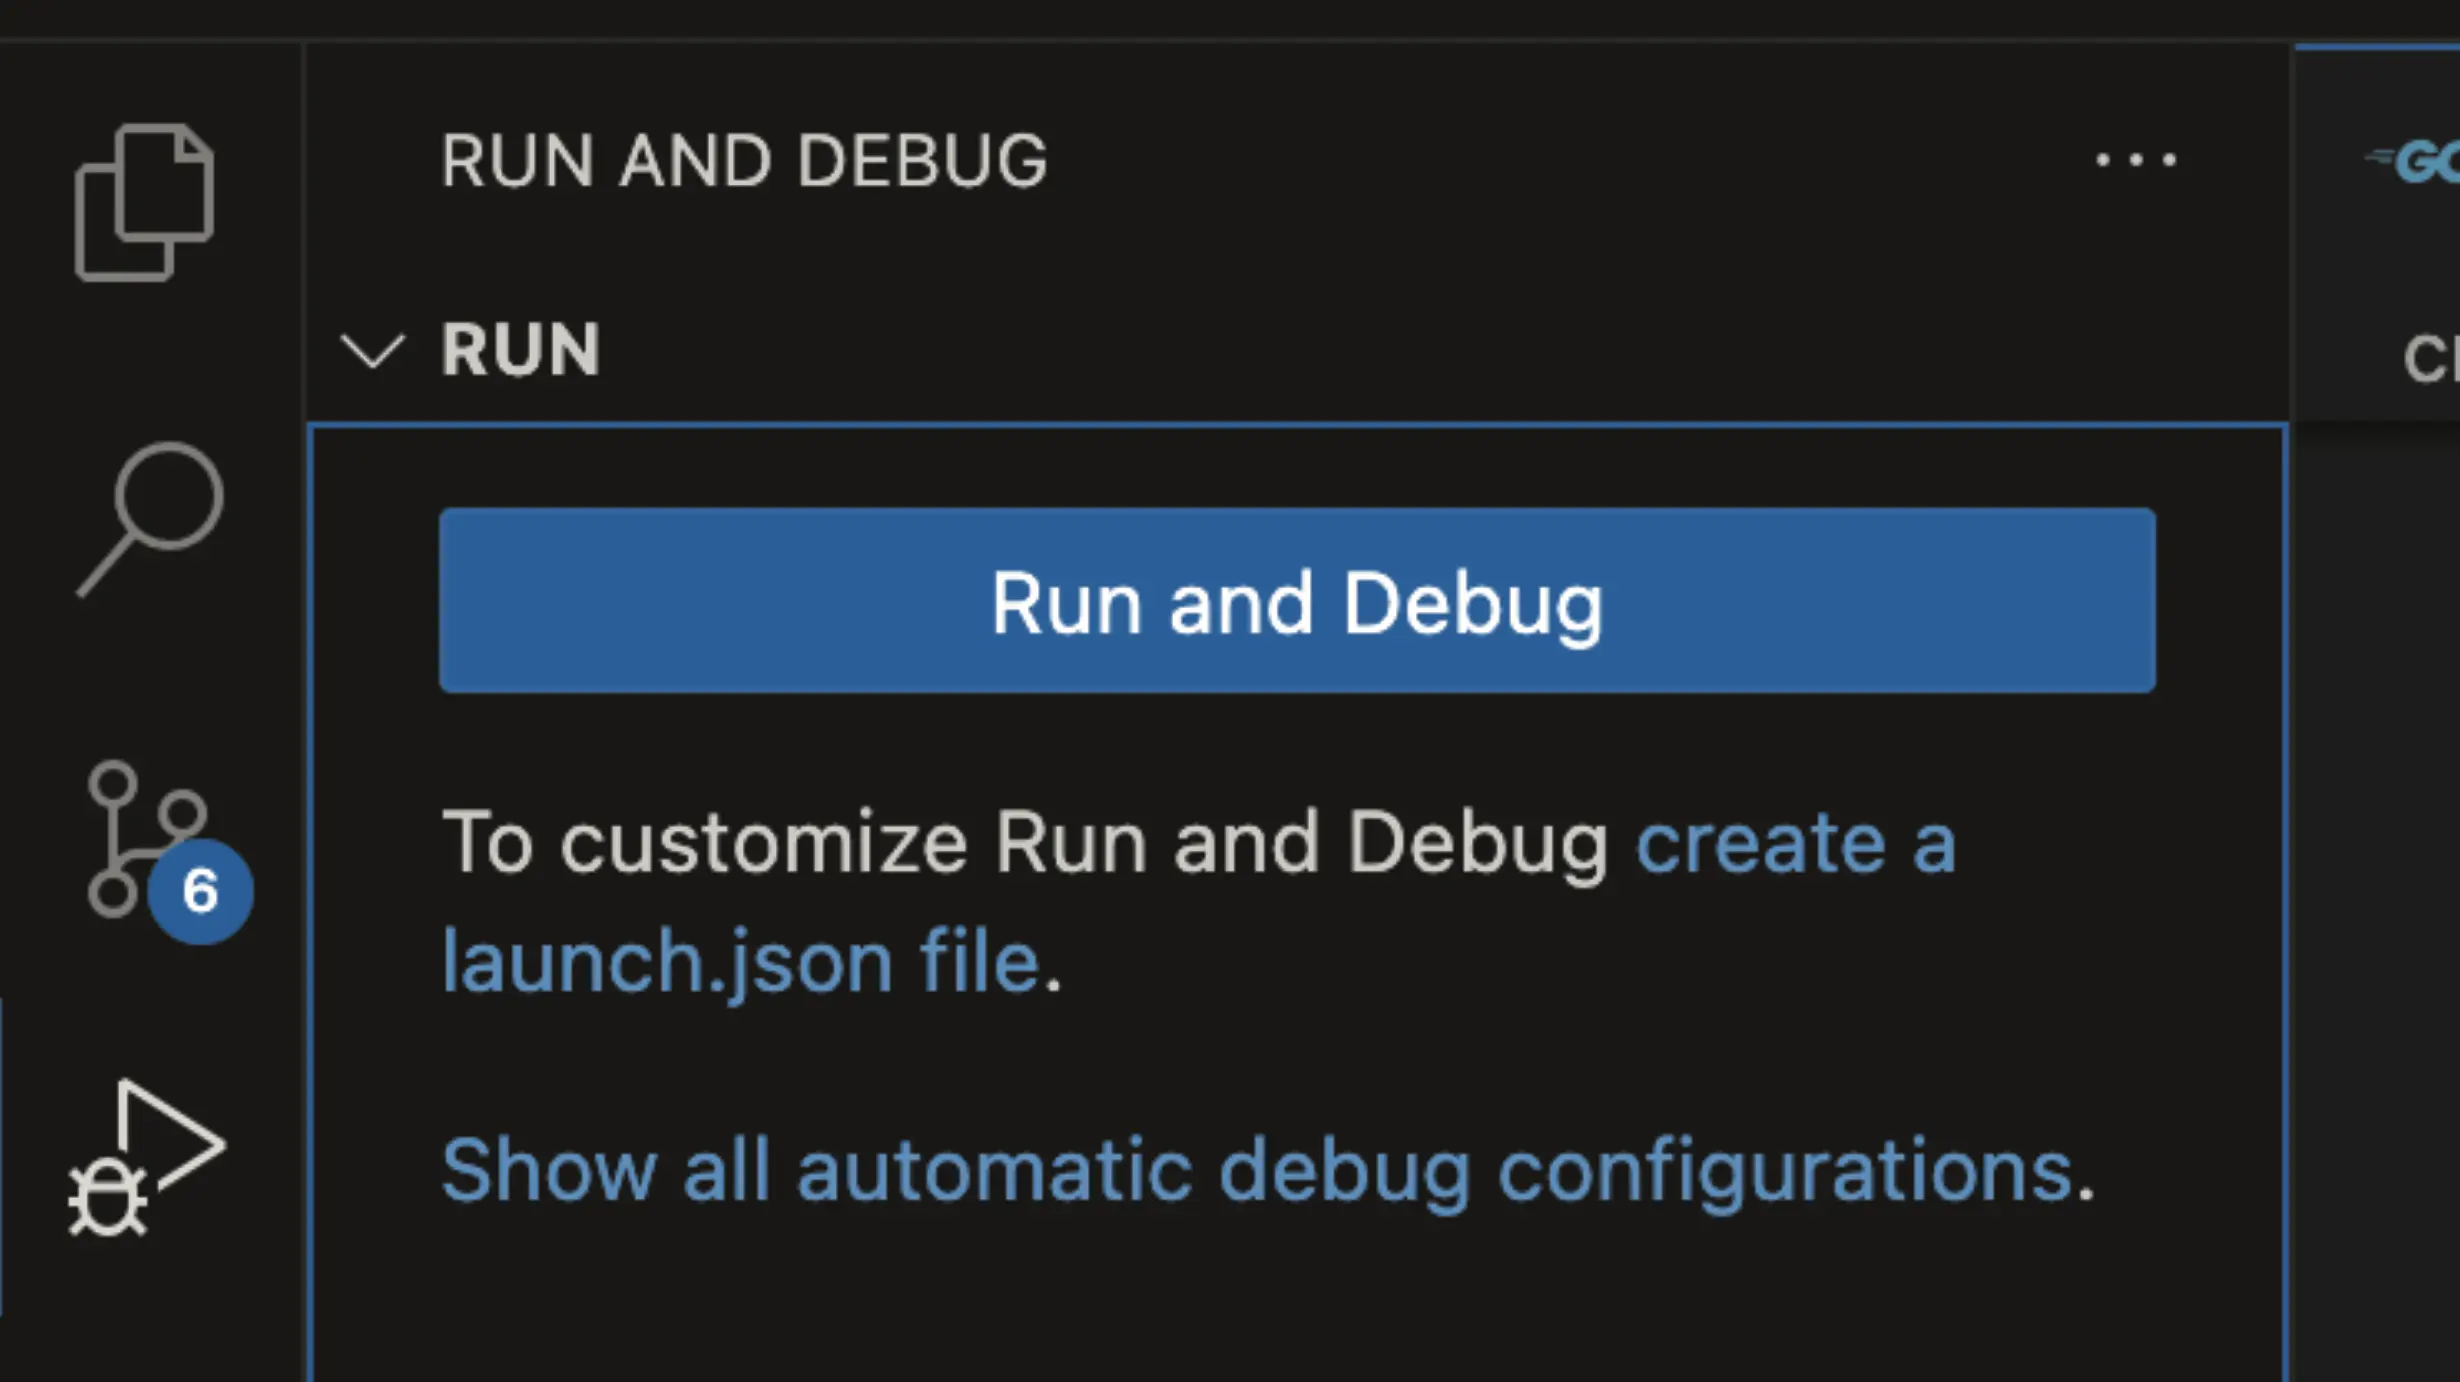
Click create a launch.json file. Here is a basic one which should help you get started:
{
  // Use IntelliSense to learn about possoble attributes.
  // Hover to view descriptions of existing attributes.
  // For more information, visit: https://go.microsoft.com/fwlink/?linkid=830387
  "version": "0.2.0",
  "configurations": [
    {
      "name": "Launch Package",
      "type": "go",
      "request": "launch",
      "mode": "auto",
      "program": "${fileDirname}"
    }
  ]
}
Once you have copied this, you should have the option to click “launch pack” in the Run and Debug menu:
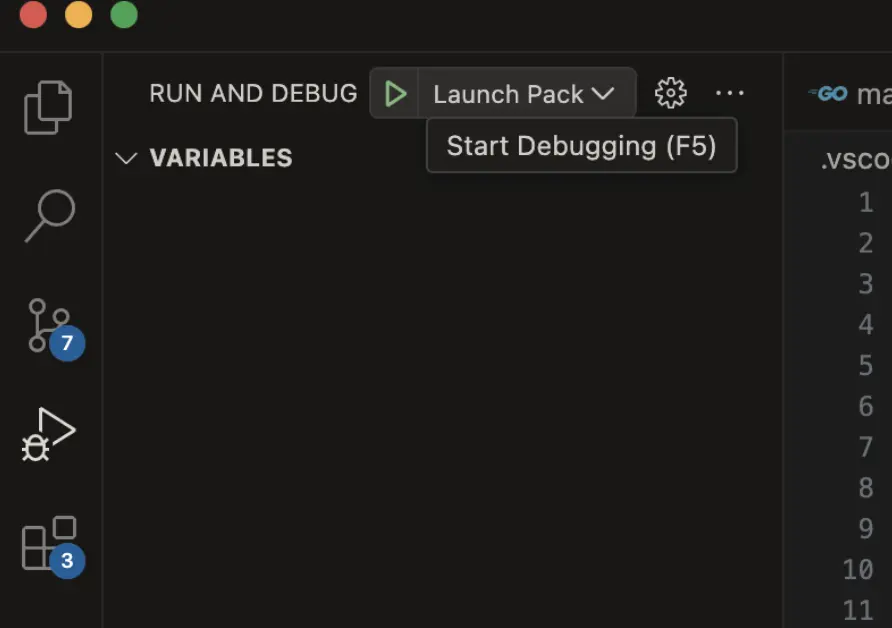
If you click this, you should see your application begin running, and then pause at your breakpoint as follows:
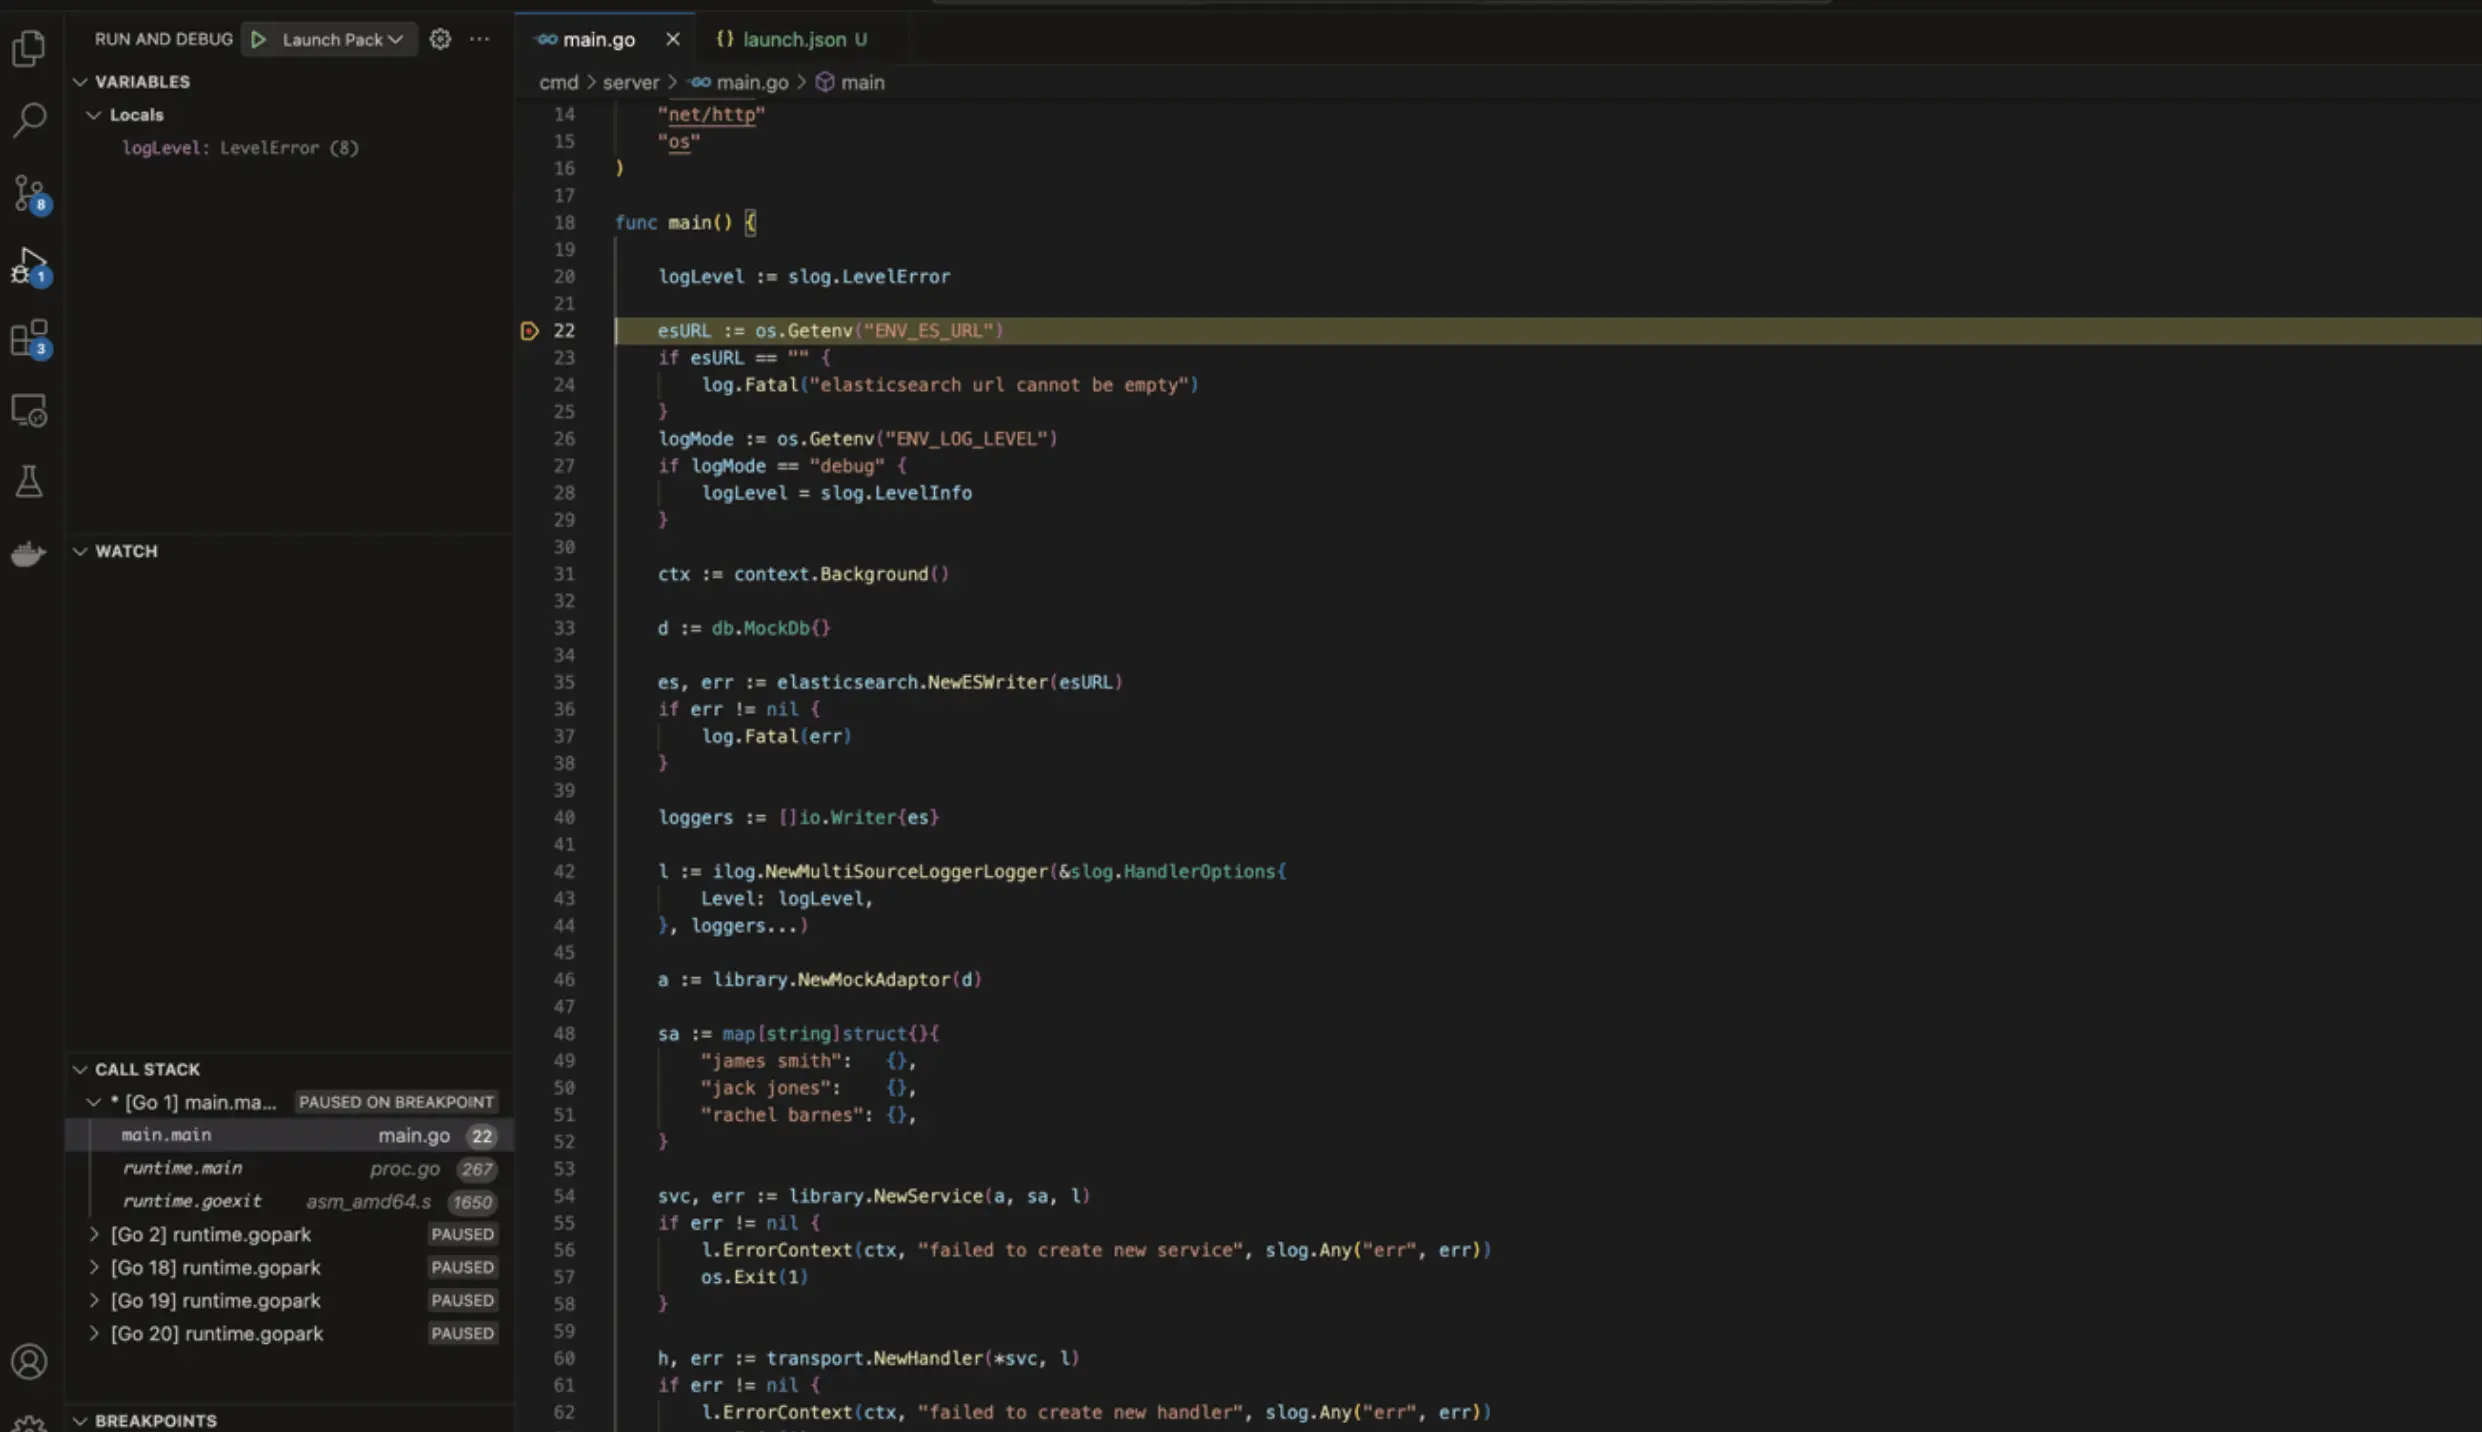
You can see it has highlighted where it was paused, and we have some new panels on the left of my screen. One is showing me variables that I have defined and I can take a look at their values.
On the bottom left it shows me the callstack. We can use this to switch between various goroutines and other useful functionalities.
If you want to learn more about this, as well as many other techniques to grow as a Go engineer, you should check our Debugging course.
