Getting Started with Tracing & Open-Telemetry Locally Using Go
OpenTelemetry enables you to instrument your Go application with logs, traces, and metrics, allowing you to view them all in one place through a UI. There are several options for the UI (or collectors), but I chose to use Jaeger for my course.
To get started, create a docker-compose.yaml file with the following content:
version: '3'
services:
  jaeger:
    image: jaegertracing/all-in-one:latest
    ports:
      - "16686:16686" # UI
      - "14268:14268" # Collector
      - "14250:14250" # gRPC
      - "9411:9411"   # Zipkin
Then, run docker-compose up to start the tracing stack.
Here’s a minimal Go application to demonstrate everything is working:
package main

import (
"context"
"log"
"net/http"

    "go.opentelemetry.io/contrib/instrumentation/net/http/otelhttp"
    "go.opentelemetry.io/otel"
    "go.opentelemetry.io/otel/exporters/jaeger"
    "go.opentelemetry.io/otel/sdk/resource"
    "go.opentelemetry.io/otel/sdk/trace"
    semconv "go.opentelemetry.io/otel/semconv/v1.7.0"
)

func main() {
// Initialize Jaeger Exporter
exporter, err := jaeger.New(jaeger.WithCollectorEndpoint())
if err != nil {
log.Fatal(err)
}

    // Create Trace Provider
    tp := trace.NewTracerProvider(
        trace.WithBatcher(exporter),
        trace.WithResource(resource.NewWithAttributes(
            semconv.SchemaURL,
            semconv.ServiceNameKey.String("app-one"),
        )),
    )

    otel.SetTracerProvider(tp)

    http.Handle("/", otelhttp.NewHandler(http.HandlerFunc(SimpleHandler), "Hello"))
    log.Fatal(http.ListenAndServe(":8081", nil))
}

func SimpleHandler(w http.ResponseWriter, r *http.Request) {
_, _ = w.Write([]byte("Hello, World!"))
}
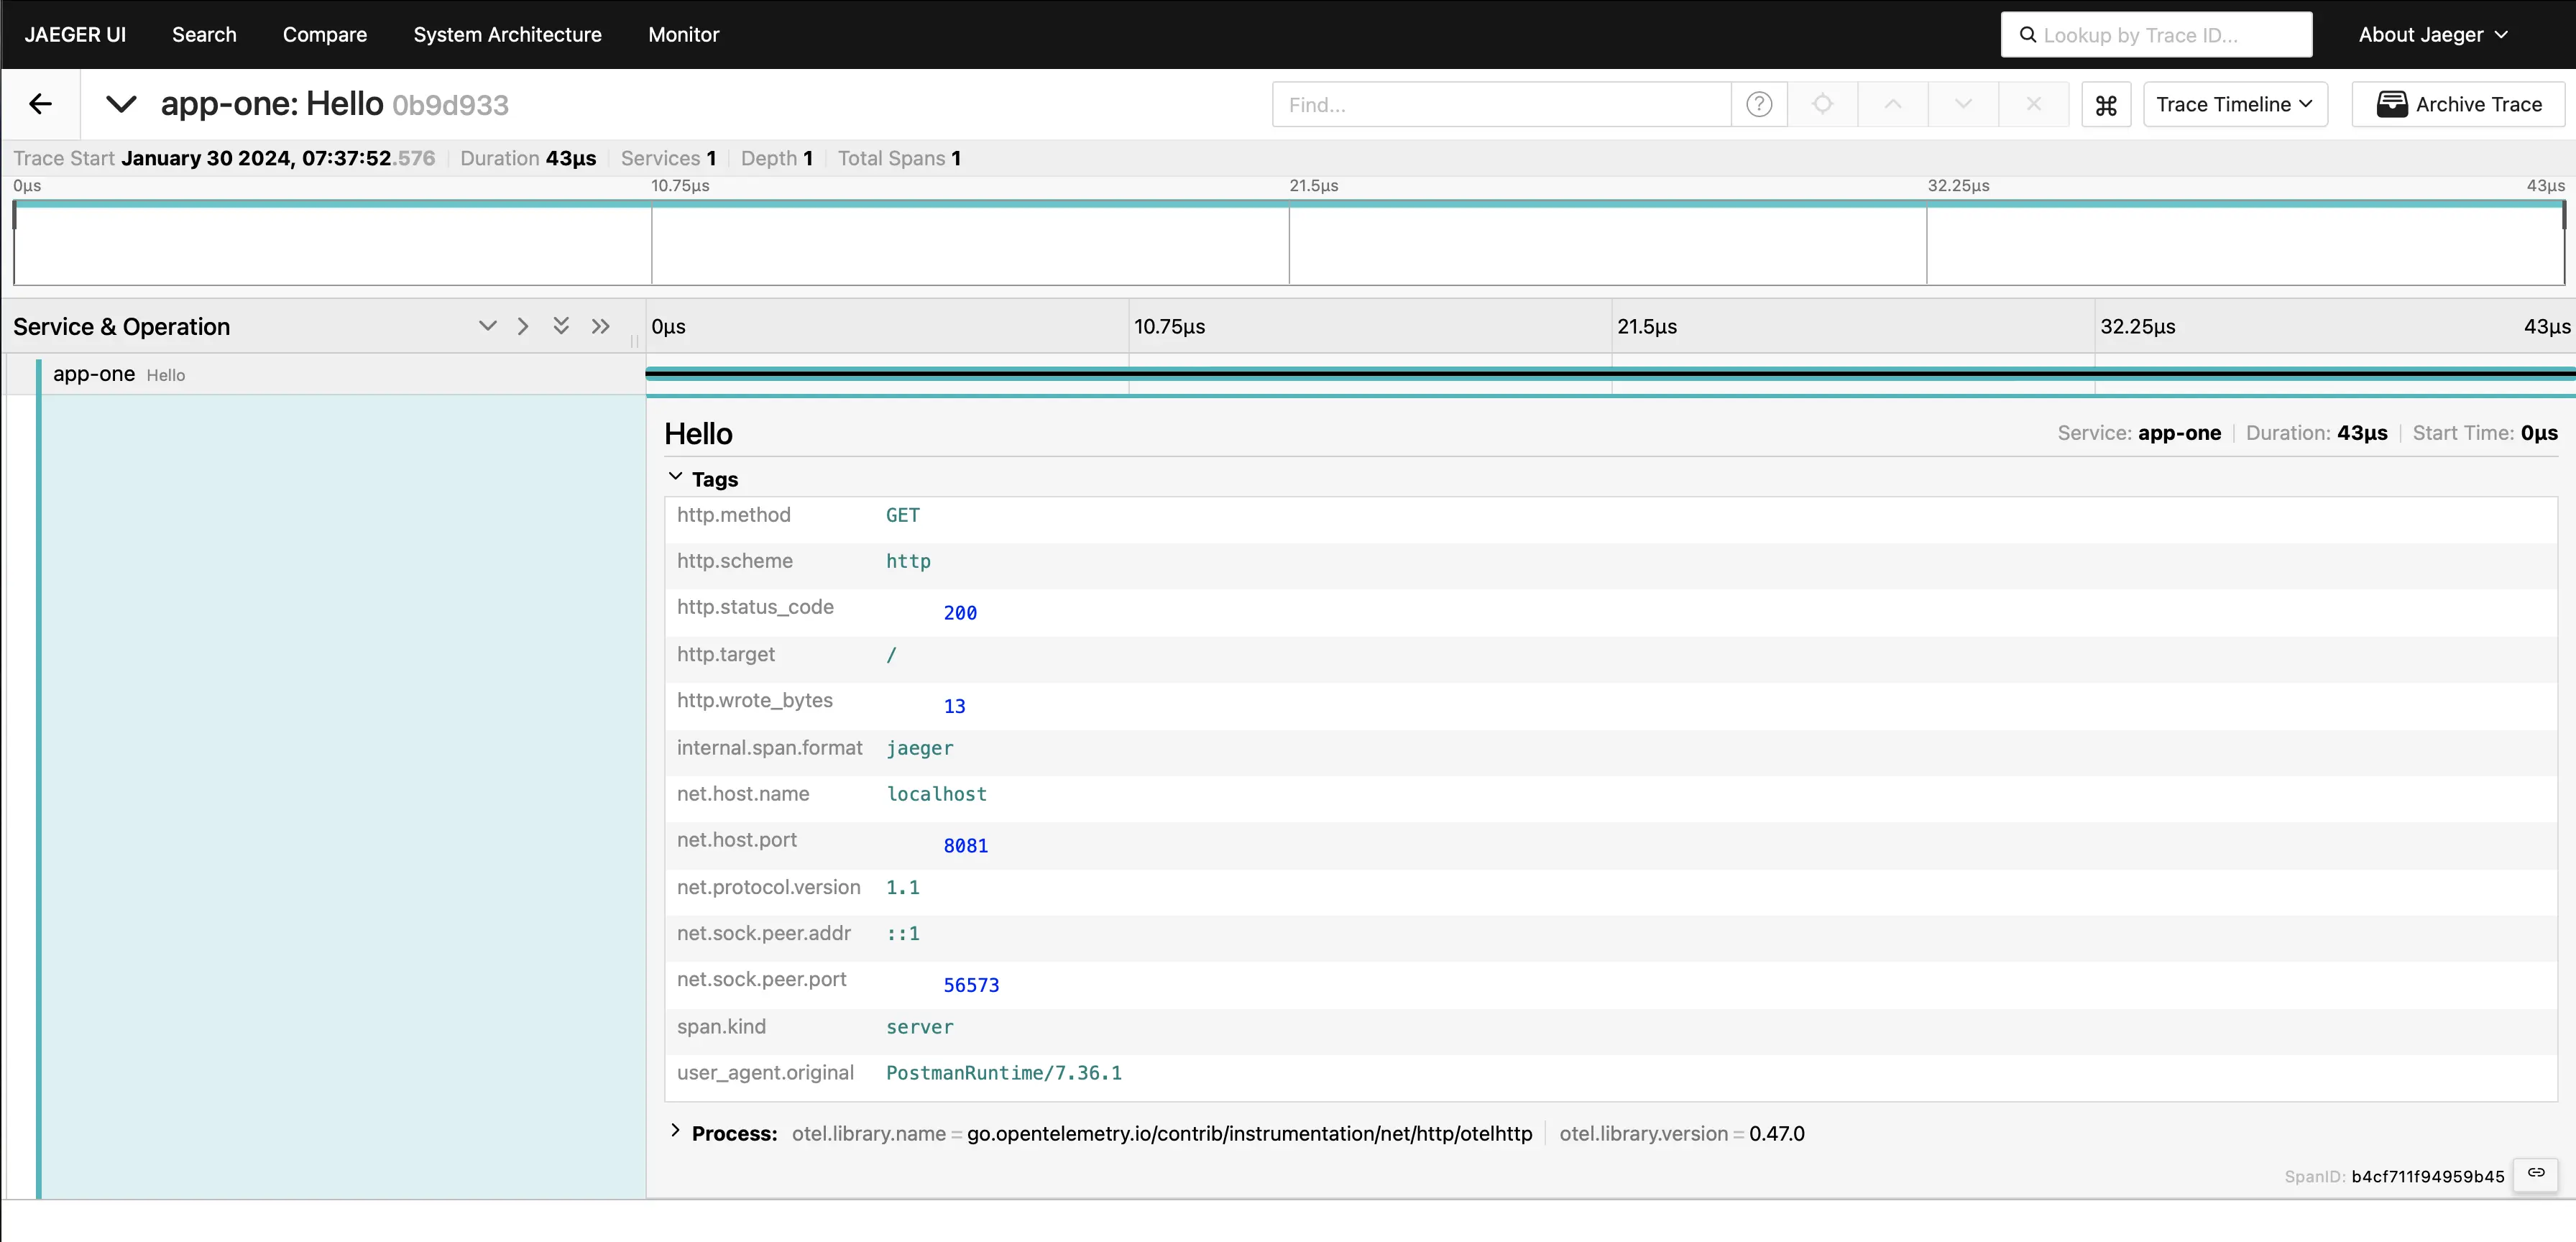
Once this is running, you can make a GET request to http://localhost:8081/. You should receive a 200 OK response.
If you now navigate to http://localhost:16686, you should see a trace in the UI!

This is just scratching the surface of what you can do with OpenTelemetry. You can read more about it here.
We’ll also be digging in much deeper in our debugging course, so be sure to check that out!
